Saturday, August 30, 2008

How to research a seller's mortgage

We recently covered one family who is planning to buy later this year because this family knows sellers tend to become very motivated during the fall and winter months. Shopping the off season is a great way to purchase a home at a nice price, but there are plenty of other ways that you can "buy smart", regardless of the time of year. One of those ways is to research the seller's mortgage prior to making your offer.

Let's suppose you've found the home for you and you're preparing to make your offer. Before you write your offer, you want a better understanding of how much wiggle room the seller has between the list price and the balance on the mortgage. Here's how you do it:

  1. Go to to the Tapestry Record Search website, a tool for researching recorded real estate documents.
  2. Click Search Now.
  3. Select Dane County from the Choose a County drop-down list.
  4. Enter the seller's first name and last name and click Search.
  5. Agree to the terms and conditions and click Continue.
  6. Next, enter your credit card information and submit (the cost for a search is $5.95).

A document summary will appear, something like this:

The first document in the above list represents a mortgage that has been recorded on the property. Double-clicking this first entry will take you to a summary of the mortgage. You'll see in this particular example the mortgage was recorded on 12/18/2007 for $284,000.


The other document in this example is the Trustees Deed - the deed that was recorded at the time that the property changed hands. From the deed you can see the home was purchased for $355,000.


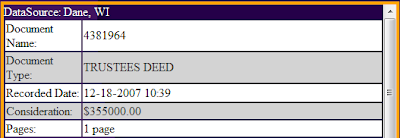
In this simple example the owners of this home had $71,000 in equity ($355,000 - $284,000) when they purchased their home. This is great information to have prior to a negotiation and very much worth the $5.95 and 5 minutes of time that it takes to produce.

In addition to mortgages and deeds, there are plenty of other documents on Tapestry, including: second mortgages and home equity lines of credit, mortgage satisfactions (i.e. payoffs), liens, and lis pendens filings initiated by banks for properties that may be subject to foreclosure.

If you're working with a buyer agent, your agent can do this research for you. We'll cover other ways that buyers and buyer agents can research properties in our next few posts.

For related information, view our DaneCountyMarket.com article that lists 8 key questions buyers should ask prior to making an offer.

Friday, August 29, 2008

Cute photo from a recently expired listing

I happen to like dogs, but some people don't. It's best to keep pet photos out of your listings. Have a great holiday.


Thursday, August 28, 2008

How one family is playing the market

Here's a story about one family that is implementing a very deliberate home-buying plan.

Last spring this family decided to sell their condo on Madison's west side. When they put their condo on the market, they listed it at a good market price and it sold very quickly. They actually lost $10,000 on the sale of their condo, but they were happy to take that loss. Since that time they have been saving money every month by renting another condo in the neighborhood (which is on the market, but not at a market price). Their monthly rent is only half of their previous mortgage payment, and by renting they've eliminated their property taxes.

Now I'm helping this family implement a buying plan that we'll start this fall. Why this fall? Because this family knows that sellers tend to become very motivated during the fall and winter months when sales volume dips (see chart below).


And motivated sellers means better deals and better prices. Take a look at the graph below. Note how prices tend to be lower during the months that span from January through April. People who end up buying (i.e. closing) during these low-price months are the ones who are out shopping, negotiating, and making offers in October, November, December, January and February - the slowest months of the year. These are the months when sellers tend to be nervous and more willing to be flexible when it comes time negotiate.

Even prices are seasonal in real estate, which means the fall and winter months can be a great time to shop for a new home. Inventory is high, so there will be plenty of homes to choose from in the coming months.

I'll provide an update on my buyers later this fall.

Wednesday, August 27, 2008

Dane County combined home and condo prices were lower in July

The preliminary Dane County market statistics are in for the month of July. The median home and condo price in July was lower by 1% from July of 2007; the year-to-date median price was lower by .2%.


July home and condo sales were down by 10%, while year-to-date sales were lower by 23%.

Far from stellar results, but consider these national trends from other data sources:

The Dane County market certainly needs to get better (especially the condo market), but once again the national numbers show that we've avoided the meltdown that is occurring in other parts of the country.

Monday, August 25, 2008

One couple's brush with foreclosures

I'm assisting a young couple in the process of buying their first home. They currently rent in Fitchburg and work in Madison. They've decided they would like to focus their home search in the city of Evansville, located to the south of Madison in northern Rock County. Why Evansville? They are looking for more home value in exchange for a longer commute and higher commuting costs.

We recently toured 5 starter homes together in Evansville, and it turned out that 2 of the homes are foreclosed homes owned by banks. One home is owned by Countrywide. The Countrywide home is only a year old, with vaulted ceilings, an open layout, tile flooring, a gas fireplace, and a modern feel. A great home in many ways.

Unfortunately, when we went to the basement we found standing water in several spots - even though it had not rained in a few days. Some of the water was due to a leaky pipe from the kitchen above. The other puddles were due to seepage in the foundation. In fact, we found more than just water entering the house from the outside. In one spot there was actually a large amount of dirt and sand that had flowed into the basement through the space between the foundation wall and foundation floor.

Foreclosed home #2 is owned by a local bank. This home's warts were apparent from the time we entered the home. There were cobwebs in the doorway, the carpet was stained, and the home was in need of a thorough cleaning throughout. Similar to the Countrywide home, the basement had serious water problems. The water had been recently removed from the basement, but the smell of mold was everywhere. We could see mold growing in one spot, but most of the drywall in the basement had been recently covered up with new wainscoting and new wood trim. My buyers were left wondering what was underneath the new wainscoting. They had seen enough.

The homes we've covered above are representative of a lot of bank-owned homes. The owners don't have an emotional investment in the homes; the properties are one of many in a portfolio of other foreclosed properties. Most of the homes are vacant, and many of them don't receive the level of care and oversight they need to ensure they are properly maintained - and ready to sell in the current buyer's market. As a result, many of these properties sit on the market until someone gets realistic about what it will take to get them sold.

Yes, foreclosed homes represent an opportunity for finding a good home value, but there can be a lot of work and patience that goes into finding the right home, in the right location, in the right condition, at the right price. We'll spend more time on this topic a little later in the year.

Thursday, August 21, 2008

Dane County condo months of inventory by price range

On August 8th we took a snapshot of the Dane County condo market and measured the months of inventory by price range. The results show an especially competitive market for condos priced $600,000 and up. For example, take a look at the $800,000 and up price category. A total of 28 condos were on the market as of August 8th, but only 4 units in this price category had sold during the previous year. That's 84 months - or 7 years - of inventory.

It's no surprise we are seeing aggressive buyer incentives and new prices for some of Madison's luxury condo developments. Stay tuned as we take a look at the months of inventory by price range again later this year.

For additional information on Dane County condo months of inventory, check out these pages at DaneCountyMarket.com:

Wednesday, August 20, 2008

Dane County condo sales are decreasing across most price categories

And much of the decrease is occurring in the more affordable price ranges. Check out the chart below, which compares the number of Dane County condo sales from the first 6 months of 2007 to the number of sales from the first 6 months of 2008. Sales have declined by at least 30% in all of the price buckets ranging from $125,000 to $274,999.

We recently saw a similar trend emerge when we looked at the change in sales volume for single family homes. Sales continue at a sluggish pace in most price categories, with home and condo sales in many of the most affordable price buckets taking a big hit.

Monday, August 18, 2008

Dane County housing starts continue to trend lower

Thanks to MTD Marketing Services of Wisconsin, we'll be providing regular updates on Dane County housing starts from this point forward. Check out this graph:


The 50 housing starts in July represent a low point over the last three-and-a-half years. Here's how the number of housing starts stack up for each of the last 4 Julys, dating back to 2005:

  • July 2005: 177
  • July 2006: 111
  • July 2007: 86
  • July 2008: 50

On a year-to-date basis, housing starts are down 41% from last year.


Where will housing starts be heading in the near future? Expect housing starts to remain soft, as builders wait for evidence that more buyers are entering the market.

For more information on Dane County housing starts, including a historical view dating back to the year 2000, visit the real estate trends page at DaneCountyMarket.com.

Saturday, August 16, 2008

Mortgage rates edge higher but remain at historically low levels

Mortgage rates have edged higher in recent weeks, according to surveys administered by Freddie Mac.

As of August 14th, the average commitment rate for a 30 year fixed rate loan was 6.52%, up about six-tenths of a percent from rates in April. The average commitment rate for a 15 year fixed rate loan on August 14th was 6.07%, also up about six-tenths of a percent.


Rates still remain low by historical standards. Check out this graph which shows rates dating back to 1992.

Rates in the 1990s for 30 year fixed rate mortgages ranged between 6.5% and 8.5% before heading below 6% during the housing boom that ended in 2005. Since that time, rates have largely been below 6.5%. Not bad at all compared to where rates have been in the past.

Friday, August 15, 2008

Dane County prices were higher in Q2 2008, Wisconsin and National prices were lower

More evidence that the Dane County real estate market is faring well compared to most other markets around the country. Yesterday the National Association of Realtors and Wisconsin Realtors Association released their median price and sales volume statistics for the second quarter of 2008 (April through June).

Median Price
  • The Q2 2008 median price for Dane County homes and condos increased by 1.1% from Q2 of 2007
  • The Wisconsin median price decreased by 3%
  • The National median price decreased by 7.6%


Sales Volume

  • Dane County Q2 2008 home and condo sales decreased by 23% from Q2 2007
  • Wisconsin home and condo sales decreased by 21%
  • National home and condo sales decreased by 16%

Dane County sales continue at a sluggish pace, but prices are holding up very well compared to other markets around the state and country. Two big reasons for this are Dane County's stable economy and low unemployment rate.

For more information on the Dane County single family home and condo market segments, visit the real estate trends page at DaneCountyMarket.com.

Thursday, August 14, 2008

Dane County foreclosures increase in July

Dane County foreclosures increased in July, although at a more moderate rate compared to earlier months this year. Foreclosures increased from 71 in July of 2007 to 91 in July of 2008, an increase of 28%.


The graph below shows the number of Dane County foreclosure filings dating back to January of 2005. Monthly filings have been above the 80 mark for 11 of the last 12 months, but are off their peak from earlier this year.


Year-to-date foreclosures through the month of July increased from 466 in 2007 to 723 this year, an increase of 55%.


How will rising foreclosures impact the Dane County real estate market? Expect inventory levels to remain high as more and more foreclosed homes work their way through the legal process and onto the open market.

For more information on the latest foreclosure trends, visit the economic trends page at DaneCountyMarket.com.

Wednesday, August 13, 2008

Required marketing time varies significantly by price range for Dane County homes

Our last post covered how the months of inventory for Dane County single family homes vary significantly by price range. The total required marketing time also varies significantly by price category. Check out the chart below, which shows the total required marketing time for Dane County homes through the first 6 months of the year.

Although homes at less than $275,000 are taking on the average under 8 months to sell, there is a clear jump up in the $400,000 and up price categories, where the months of inventory is 12 months and up.

Higher months of inventory create a more competitive market and drive marketing times higher - another reason why marketing, staging and pricing are so critical at the higher price points.

Tuesday, August 12, 2008

Dane County months of inventory vary significantly by price range

On Sunday we covered the change in sales volume for Dane County homes by price range. The results were a bit surprising, with homes in the $175,000 to to $274,999 price range showing the largest sales decrease (on a percentage basis) compared to last year. Although sales have decreased significantly within the $175,000 to $274,999 price range, the months of inventory remain much lower compared to homes in higher price categories.

In the table below you'll see the months of inventory for homes under $275,000 are at or below the Dane County average of 9 months. On the flip side, the months of inventory for homes $325,000 and up range from 10.1 months to 28.6 months.


It's interesting to note there are roughly the same number of homes on the market within the $200,000 to $224,999 price range (308 homes) as there are within the $400,000 to $499,999 price category (275 homes). However, more than twice as many homes sell each month in the lower price range - 50 homes per month versus 22 in the higher price category.

With fewer buyers out in the market for higher priced homes, sellers in the higher price ranges need to be especially competitive with their listings. Aggressive marketing plans, thoughtful staging, and sound pricing all play a very big role in getting homes sold at the higher price levels. For more information on marketing, staging and pricing, feel free to visit our Selling Real Estate page at DaneCountyMarket.com.

Monday, August 11, 2008

WSJ article about gas prices and Dane County real estate

This article comes from Marv Balousek of the Wisconsin State Journal and includes interviews of area homeowners and real estate agents.

Gas prices have certainly become an important factor for some, but the data for 28 area communities does not yet suggest a clear pattern where buyers are choosing Madison and other more central locations over Dane County ring communities. We'll revisit this topic later this year after we've accumulated additional sales data.

Sunday, August 10, 2008

Dane County home sales are decreasing across most price ranges

But not all price ranges. The table below compares Dane County home sales (no condos) during the first 6 months of 2007 to the number of home sales during the first 6 months of 2008.


Sales for homes selling for less than $100,000 and for between $125,000 and $149,999 have increased during the first 6 months of the year.

Meanwhile homes selling for between $175,000 and $274,999 have experienced the largest sales decreases, ranging from 28% to 38.2%, depending on the price bucket. So far it's the homes in the bread and butter price categories that are experiencing the largest sales declines from the previous year.

We'll continue to look at the market by price range over the next two weeks. In our next post we'll look at the months of inventory by price range for Dane County single family homes.

Saturday, August 9, 2008

How long does it take to sell the average Dane County Condo?

About 19.5 months (593 days), based on our year-to-date calculations using data that is available from the South Central Wisconsin MLS. Last year's average through the month of June was about 15.9 months (485 days).


For frame of reference, the average time required to sell a Dane County condo during the first 6 years of the decade was consistently in the range of 5 months (about 150 days).


Why are the Dane County condo numbers so high? Due to the large increase in condo supply and recent decrease in condo sales. Many new condos have entered the market in the last 2 to 3 years and have yet to sell.

Keep in mind that the numbers listed above are averages only. Plenty of condos end up selling more quickly than the average. And quite a few end up taking more time to sell.

For related articles you can visit these pages at DaneCountyMarket.com:

Dane County housing starts at lowest levels in at least a decade

Dane County housing starts in the month of July remained low, according to a Wisconsin State Journal article (print only) from Friday's edition.

The Dane County numbers

  • 50 permits for homes and duplexes were issued in July compared to 85 permits in July of 2007, down 41%.
  • 430 permits were issued through the first 7 months of the year compared to 716 permits during the same time period last year, down 40%.

The Madison numbers

  • 95 permits were issued year-to-date through the month of July compared to 213 permits during the same time last year, down 55%.

According to the data source, MTD Marketing Services, Dane County housing starts are at their lowest levels in over a decade. This is tough news for the building industry, but a baby step toward driving Dane County inventory lower.

Friday, August 8, 2008

Dane County condo mid-year review

Here's how the Dane County condo market fared during the first 6 months of 2008 versus the same time period last year. All data comes from the South Central Wisconsin MLS.

  • Year-to-date median price: $165,150 in 2008 vs $168,500 in 2007, down 2%
  • Sold listings: 656 in 2008 vs 956 in 2007, down 31.4%
  • Listing success rate: 37.9% in 2008 vs 42.3% in 2007, down 4.4%
  • Days on market (sold listings): 166 days in 2008 vs 147 days in 2007, up by 19 days
  • Days on market (expired listings): 261 days in 2008 vs 248 days in 2007, up by 13 days

Here's a Dane County condo inventory comparison, July 31st of 2008 versus July 31st of 2007:

  • Active listings: 2,242 listings on 7/31/2008 vs 2,473 listings on 7/31/2007, lower by 231
  • Months of inventory: 18.3 months on 7/31/2008 vs 16 months on 7/31/2007, higher by 2.3 months
For our full set of year-to-date condo statistics, visit our Dane County Condo Snapshot at DaneCountyMarket.com. In our next post we'll cover how the total required marketing time for the average Dane County condo has changed since 2007.

Pending home sales are down, prime mortgage delinquencies are up

The June 2008 national pending home sales index released yesterday by the National Association of Realtors dropped by 12.3% from last year's value. The index is intended to be a leading indicator of future closings. According to the NAR:

"A sale is listed as pending when the contract has been signed but the transaction has not been closed."

Based on the latest pending home sales figure, expect Dane County sales volume to remain lower over the next several months.

The Wall Street Journal also published an article yesterday on the delinquency rate for mortgages originated in 2007. According to a study conducted by the FDIC, .91% of "prime" mortgages originated in 2007 were seriously delinquent after 12 months. The equivalent number for mortgages originated in 2006 was .33%.

Stay tuned as we continue to track foreclosures at DaneCountyMarket.com and in the foreclosure topic of our blog.

Thursday, August 7, 2008

How long does it take to sell the average Dane County home?

About 7.8 months (236 days), based on our year-to-date calculations using data that is available from the South Central Wisconsin MLS. Last year's average through the month of June was about 6.6 months (201 days).


For frame of reference, the average time required to sell a home during the first 5 years of the decade was consistently in the range of 3 months (about 90 days).

This statistic, perhaps more than any other, shows just how competitive the market has become. Yes, the market is experiencing price pressures, but the time and effort that goes into selling a home has changed dramatically over the last 3 years.

We'll be providing an update on the average time required to sell a Dane County condo in the near future. For related articles you can visit these pages at DaneCountyMarket.com:

Tuesday, August 5, 2008

A mid-year review of the Dane County single family home market

Here's how the Dane County single family home market fared during the first 6 months of 2008 against the same time period last year. This data includes homes only (no condos). All data comes from the South Central Wisconsin MLS.

  • Year-to-date median price: $225,000 in 2008 vs $227,000 in 2007, down .9%
  • Sold listings: 2,107 in 2008 vs 2,698 in 2007, down 21.9%
  • Listing success rate: 53% in 2008 vs 55.1% in 2007, down 2.1%
  • Days on market (sold listings): 89 days in 2008 vs 76 days in 2007, up by 13 days
  • Days on market (expired listings): 166 days in 2008 vs 153 days in 2007, up by 13 days

Here's a comparison of single family home inventory, July 31st of 2008 versus July 31st of 2007:

  • Active listings: 3,293 listings on 7/31/2008 vs 3,338 listings on 7/31/2007, lower by 45
  • Months of inventory: 9 months on 7/31/2008 vs 7.9 months on 7/31/2007, higher by 1.1 months

When will the pendulum start to shift back to the seller? When sales start to pick up and inventory begins to recede in a meaningful way. Until that time, we can expect to see high marketing times and slightly positive to slightly negative price growth, depending on location.

We'll cover how the total required marketing time has changed for the average Dane County home seller in our next post. After that we'll provide a mid-year review of the Dane County condo market.

For more information on the Dane County single family home market, you can visit our year-to-date snapshot here.

Monday, August 4, 2008

Fewer Dane County homes are on the market, but months of inventory have reached new highs

We took a snapshot of the Dane County MLS inventory on July 31st and compared current inventory levels to the levels from July 31st of last year.

There are fewer active listings on the Dane County real estate market right now compared to the same time last year:

  • Homes: 3,293 active listings on July 31st, down by 45 from last year
  • Condos: 2,241 active listings on July 31st, down by 231 from last year
  • Combined: 5,535 active listings on July 31st, down by 276

The trend toward fewer listings is a step in the right direction for the market; however, months of inventory have risen to new highs due to the recent decrease in sales:

  • Homes: 9 months on July 31st, up from 7.9 months last year
  • Condos: 18.3 months on July 31st, up from 16 months last year
  • Combined: 11.3 months on July 31st, up from 10 months last year

We'll continue to track the latest Dane County inventory trends throughout the year. For more information, you can also visit these links on DaneCountyMarket.com:

Sunday, August 3, 2008

Dane County home and condo sales were lower in June

The trend toward fewer Dane County home and condo sales continued in June, with the larger decrease occurring in the condo market.

For the month of June

  • Dane County combined home and condo sales were lower by 22.3% compared to June of 2007.
  • Home sales were lower by 17.3%.
  • Condo sales were lower by 35.4%.

Year-to-date through the Month of June

  • Dane County combined home and condo sales were lower by 24.4% compared to the same time period last year.
  • Home sales were lower by 21.9%.
  • Condo sales were lower by 31.4%.

The graph below shows the change in monthly sales (homes and condos combined) dating back to January of 2007. Prior to September of last year, monthly decreases were relatively modest, ranging mostly between 5 and 10 percent. The trend toward larger monthly decreases started in September, and since that time monthly decreases have been ranging between roughly 15 and 35 percent.


This graph separates the monthly volume change for homes and condos. The decrease in home sales (red bar) has moderated in recent months, while the decrease in condo sales (blue bar) has intensified. In fact condo sales have decreased by at least 30% each of the last 3 months.


Our preliminary review of the July numbers indicates that Dane County condo sales will be lower again, but by a more moderate level compared to the last 3 months.

With high inventory levels and fewer sales, the Dane County condo market remains extremely competitive. We've seen evidence in recent advertisements that local condo developments are offering larger buyer incentives and even lower prices in order to attract more buyers. This article confirms that at least one area condo development has decided to lower its prices.