If so, send me an email at danielmiller@kw.com. I'll be returning to the blog in about two weeks. Thanks!
This is the End and a New Beginning
3 months ago
If so, send me an email at danielmiller@kw.com. I'll be returning to the blog in about two weeks. Thanks!
The preliminary Dane County real estate numbers are in for the month of June...


The median price for a Dane County condo was significantly lower in June, registering at $156,900, down 10.4% from the June 2007 price of $175,077. The year-to-date price was also lower, registering at $164,900, down 2.1% from the year-to-date price of $168,500 in 2007.


The National Association of Realtors will be releasing their national price and volume numbers for the month of June on Thursday. Stay tuned...
We recently explored this topic by analyzing the sales data for 28 different locations. You'll find the details here.
Sometimes the statistics don't add up until you peel the onion to uncover what is going on in a particular neighborhood. I ran into this last week when I was helping a friend price her home in Waunakee. She lives in Savannah Village, a newer community that is home to some beautiful houses, most of them priced between $350,000 and $700,000. Savannah Village has 3 parks, a neighborhood pool and an elementary school, making it a popular location for growing families.
We began our homework by looking at the overall price trends for the village of Waunakee. The MLS statistics for Waunakee show that the median home price has been rising this year. In fact, the median price for a Waunakee home was up by 5.4% through the month of May.
Next, we took a closer look at the neighborhood. We started by measuring the current inventory in Savannah Village. As of last week there were 14.5 months of inventory in Savannah Village, which is about 6 months higher than the Dane County average.
We continued by reviewing comparable active listings and by analyzing recent sales in the neighborhood. Then we asked two questions which turned out to be two very good questions to ask:
Dane County foreclosures increased by 60% through the month of June after increasing by 19% in 2007. The foreclosure growth rate also intensified for the state as a whole. Statewide, foreclosures increased by 36% through the month of June after increasing by 28% the prior year.
The table below shows the 20 Wisconsin counties with the highest foreclosure growth rates through the month of June. Dane County, with its 60% growth rate, is 9th on the list. Two counties - Vernon and Sauk - have seen foreclosures grow by over 100% during the first 6 months of 2008. All of the counties in the top 20 list have foreclosure growth rates of at least 50%.

The table below shows the 20 Wisconsin counties with the lowest foreclosure growth rates through the month of June. A handful of counties have actually seen foreclosures decrease during the first 6 months of the year, but the prevailing trend for most Wisconsin counties is toward an increasing number of foreclosures in 2008.

We'll continue to report on Dane County and Wisconsin foreclosure trends as we obtain more data throughout the year. Thanks once again to Andy Lewis and Russ Kashian from the University of Wisconsin Extension, as well as Ryan Wade from Marquette Univesity, for sharing their data.
For more information on Dane County foreclosures, you can view our monthly foreclosure report on the economic trends page at DaneCountyMarket.com. We'll move on from foreclosures for now and take on a new topic in tomorrow's post.
In our last entry we posted a few links to REO web sites from national lenders. The number of local properties on these web sites is spotty at best, but there are plenty of other ways to locate homes in various stages of foreclosure.
MLS key word search terms: *foreclosed*,*foreclosure*,*as is*,*as-is*,*bank*,*bank owned*,*bank-owned*,*below assessed*,*below*,*diamond*,*fixer*,lender approval*,*lender*,*lien*,*motivated*,*potential*,*reo*,*short sale*,*short*,*subject to*,*TLC*
Keep in mind that foreclosures continue to grow, and in most cases it takes several to many months from the time that the foreclosure process is initiated until the time that a foreclosed home becomes available for purchase. With this in mind, expect the market for foreclosed homes to grow over the coming months, as more and more foreclosed homes cycle through the legal process and enter the open market.
REO (or Real Estate Owned) properties are properties that have been foreclosed upon and end up being owned by a bank or other lending institution. Some lenders have their own web sites devoted to their current inventory of properties. If you have an interest in buying a foreclosed home, an REO web site is one resource that you can use to locate a property in your area.
Here's a list of lenders with REO web sites that include South Central Wisconsin real estate:
You'll notice all of these web sites are from national lenders only. Plenty of other foreclosure properties are available beyond what is listed in the web links above. We'll cover other methods that you can use to locate foreclosure properties in our next post.
Mike Ivey from the Cap Times provides an interesting view of gas prices and Dane County real estate in today's paper.
Our last post covered foreclosure growth in Madison's east and west sides. Today's post is about foreclosure growth in Madison's surrounding communities. Once again our data comes courtesy of Professors Andy Lewis and Russ Kashian from the University of Wisconsin Extension, who analyzed Wisconsin Circuit Court data to determine the number of foreclosures by community from the years 2000 to 2007.
Foreclosures in Madison's surrounding communities grew from 130 in the year 2000 to 400 in 2007, an increase of 208% (the increase for all of Dane County, including Madison, was 193%). Six communities - Cottage Grove, Dane, DeForest, Oregon, Sun Prairie and Waunakee - experienced increases of 250% or more over the seven year period.
 For more information on the latest Dane County foreclosure trends, visit our monthly update and foreclosures by zip code article at DaneCountyMarket.com.
Today's post is about Madison foreclosures and comes courtesy of Professors Andy Lewis and Russ Kashian from the University of Wisconsin Extension. Andy and Russ analyzed Wisconsin Circuit Court data to determine the number of foreclosures by zip code from the years 2000 to 2007.
Their data shows that Dane County foreclosures grew from 306 in the year 2000 to 898 in 2007, an increase of 193%. Foreclosure growth on Madison's west side outpaced the Dane County average, growing from 46 in 2000 to 154 in 2007, an increase of 235%. West side growth was highest in the 53711 and 53719 zip codes, where a number of new homes and condos were built and purchased since the beginning of the decade. Foreclosures on Madison's east side also grew significantly, but at a slower pace of 142%. As in Madison's west side, the Madison East home-owner base increased significantly over the decade, which helped to fuel foreclosure growth. As an example, foreclosures in the 53718 zip code grew from zero in the year 2000 to 30 in 2007.
 We'll cover foreclosures in surrounding Dane County communities in our next post. For more information on Madison foreclosures, visit our foreclosures by zip code article at DaneCountyMarket.com.
Dane County foreclosures continue to rise, with 89 new filings recorded in the month of June, an increase of 29% from the 69 filings recorded in June of 2007. The graph below shows the number of monthly Dane County foreclosures dating back to January of 2005. Each red data point represents a year-over-year increase from the same month of the prior; each green data point represents a decrease. You'll see that foreclosures have been trending in the red for most of the last 3 years.


In our next post, we'll take a look at how foreclosures have grown in the city of Madison. We have some interesting data that breaks down the number of foreclosures by zip code.
Foreclosure data is public record information that is available from the Wisconsin Circuit Court website. We use this data to update our monthly Dane County foreclosure statistics on the economic trends page at DaneCountyMarket.com.
Collecting the data is easy and takes only a few minutes of time. For example, here's how we identified the number of Dane County foreclosures for the month of June:
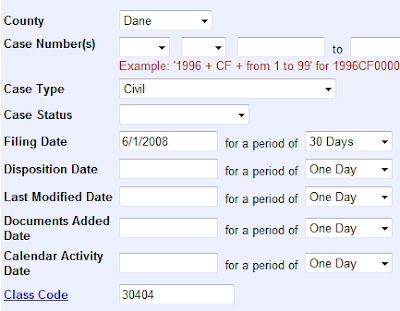
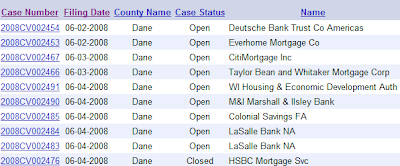
If you run through the above steps yourself, you'll see a total of 89 new foreclosures were filed in Dane County during the month of June. For each of these cases, you'll be able to drill down into the case details to view information about the plaintiff, defendant and the property (we've omitted defendant and property details from the screen shot below for obvious reasons).
In our next post, we'll begin with the first of several posts that provide an up-close look at the latest Dane County foreclosure trends. Later in the week, we'll provide information on different strategies you can use to locate foreclosure properties.
The total required marketing time for the "average" single family home seller on Madison's west side was 162 days (5.3 months) in 2007, compared to 210 days (6.9 months) for all of Dane County. The graph below shows how marketing times have grown since the beginning of the decade. Sellers had all of the leverage from 2000 to 2004, back when the average west side home sold in just over 2 months, compared to about 3 months for all of Dane County.

How do we calculate the total required marketing time? We use our knowledge of other market statistics to calculate this measure. We know how often listings sell versus expire, and we know the average days on market for those listings that sell and those that expire. When we put these measures together, we come up with an equation that looks like this:
Total DOM = DOM (sold) + DOM (expired) * [(percent expired)/(percent sold)]
For more on the Madison West market, check out our historical report on DaneCountyMarket.com, and visit our year-to-date snapshot for updates throughout the year.
We'll be covering some new real estate topics in the coming week.
Single family home days on market are increasing on Madison's west side, but marketing time remains low when compared to the larger Dane County market. This graph shows the average days on market for listings that sold for the Madison West and Dane County markets dating back to the year 2000. Note how the days on market for sold listings have increased significantly over the years, with the Madison West market consistently out-performing the larger Dane County market.

This graph shows the average days on market for expired listings dating back to the year 2000. Once again, days on market have been consistently lower within the Madison West market.
 For the 2008 sales year, our year-to-date snapshot at DaneCountyMarket.com shows that the Madison West market continues to out-perform the larger market when it comes to the marketing time for sold and expired listings.
 But there's more to the story...Given that some listings sell and some listings expire, this data doesn't tell us how long it takes to sell the average home on Madison's west side. We'll cover the total days on market experience for the average west side home in our next post.
In our last post we covered recent price and inventory trends for homes on Madison's west side. West side homes fare very well when it comes to inventory and price, and the theme continues with west side listing success rates.
The listing success rate is a good measure for assessing the relative effort required to sell a home. As an equation:
listing success rate = (sold listings)/(sold listings + expired listings)
When fewer listings sell and more listings expire, the listing success rate goes down. This is exactly what happened in 2005, 2006 and 2007 for the Madison West and Dane County single family home markets. Prior to 2005, the success rate for Madison West listings was about 80% year in and year out, compared to about 75% for Dane County listings. In 2007, the success rate for Madison's west side decreased to 58%, compared to 52% for all of Dane County.

The Madison West listing success rate has out-performed the Dane County success rate every year dating back to the year 2000, and the trend continues this year. As of May 31st of this year, the year-to-date listing success rate on Madison's west side was 60.3%, compared to 49.5% for all of Dane County. In fact, the success rate on Madison's west side is higher than any other location in the county (see the year-to-date snapshot at DaneCountyMarket.com).
In our next post we'll cover recent "days on market" trends for homes on Madison's west side. For more information on the Madison West single family home market, feel free to visit these pages at DaneCountyMarket.com:
Also view our previous post on Madison west price and inventory trends.
Year in and year out the Madison West single family home market continues to be Dane County's most consistent market. We'll take a closer look at this market over the next few days by comparing it to the larger Dane County market.
We define the Madison West market as all of the Madison MLS locations W01 through W18. Of course there are many different "micro-markets" within the west side of Madison, down to the neighborhood level. We'll cover some of these neighborhoods in more detail throughout the year.


Here's an interesting graphic that provides a good illustration of how the Dane County real estate market has changed over time. The purple line (using the left axis) represents the combined home and condo inventory at the end of each month dating back to January of 2005. The blue line (using the right axis) represents the number of homes and condos sold each month.

Real estate is all about the seasons, so when we measure the change in monthly home and condo sales, we compare the number of units sold each month to the number of units sold during the same month of the prior year.


Our preliminary review of June's data suggests we'll see similar results once the final June numbers are in. We'll have an update on the June numbers in a few weeks.
An interesting article about one alderman's proposal for increasing the use of solar and wind power in Madison...On a related note, Off the Grid, a store which sells solar power energy systems for businesses and homeowners, has opened in Madison. You can read more about Off the Grid in this recent article from the Wisconsin State Journal.
Going FSBO? Here are 6 things you can do to increase your odds for a successful sale:
For 6 additional tips, read our FSBO article at DaneCountyMarket.com.
Absolutely. Look at this screen shot from fsbomadison.com. All of the listings below are for homes on the west side of Madison. Note seven of these eleven listings have either sold or are waiting to close. Not bad at all.


Why the difference? Location is a big factor. The west side of Madison has only 6.5 months of inventory, compared to 10.8 months of inventory for the village of DeForest. In other words, housing supply relative to housing demand is much lower on Madison's west side.
If you're planning to go the FSBO route for the sale of your home, research the months of inventory for your area. If your area has 8 or fewer months of inventory, your odds for success will be quite good compared to many other sellers who choose the FSBO route.
We'll offer tips for FSBO sellers in a future post.
Our full set of monthly condo reports is on the real estate trends page at DaneCountyMarket.com. Here's a brief overview of the local condo market in May:

The number of Dane County condos sold in the month of May was 33% lower than the number of condos sold in May, 2007. Year-to-date, the number of Dane County condos sold was 29% lower than the year-to-date number of condos sold through May of last year.

Sales volume has been markedly lower this year, particularly in the condo market. We'll take a closer look at Dane County home and condo sales volume trends in a future post.
The full set of Dane County housing statistics for the month of May is now available on the real estate trends page at DaneCountyMarket.com.
Here's a brief overview of the Dane County single family home market (excluding condos):


On June 30th we measured the number of active MLS listings for Dane County homes and condos. Then we compared those listing levels to the levels of June 30th, 2007. Here are the results:

Even though fewer homes and condos are on the market this year compared to last year, the months of inventory for Dane County homes and condos are at historically high levels:
 The 11 months of combined home and condo inventory are a new high for Dane County. With the number of active listings down by over 9% from last year, how is it that the months of inventory are at historically high levels? The reason is the demand for homes and condos has slowed in recent months. With fewer buyers out in the market, sellers continue to face a very competitive landscape.
Related Articles:

