Sunday, September 28, 2008

Putting decreasing sales in perspective

According to the Wisconsin Realtors Association, Dane County home and condo sales for the second quarter (April through June) were the lowest out of any second quarter since the year 2000.


Not a startling statistic on its own - until you consider that housing inventory is near an all-time high and more than double where it stood just a few years ago.

Sellers, you may need to work harder than you think on the sale of your home.

Buyers, you may have more leverage than you think when it comes time to negotiate.


Saturday, September 27, 2008

Changes to this blog

I've deleted all posts that contain references to specific condo developments, specific properties, and specific builders. For the time being I'll refrain from covering individual projects that pop up in the media, in advertisements, and in the news. If you're interested in knowing why, you can read the reasons in our real estate blog at madison.com.

Thursday, September 25, 2008

Dane County versus National Statistics, August 2008

The National Association of Realtors released its statistics for the month of August yesterday. Sales volume at the national level was down 15% from August of last year. The median price was down 9.5%.

Once again Dane County compared well to the national market. Dane county home and condo sales in August were down by 20% from August of 2007, but the median home and condo price was lower by only 1.5%.

Wednesday, September 24, 2008

National price trends are important to Dane County

We've covered how the Dane County real estate market - even with its dramatic slowdown - is different from many other markets around the country. So far we haven't seen the huge price corrections that many other markets are facing.

Nonetheless we are a player in the larger market, and what happens in the larger market does affect us. Take a look at this graph which shows the national monthly median price ranging from January of 2005 to July of 2008.


Prices started to fall on a year-over-year basis (noted by the red data points) in the summer of 2006, which is exactly when our market started to show signs of weakening prices. What's more telling is this next graph, which shows the year-over-year price change for each month dating back to January of 2005.


The national trend toward lower prices is still very strong. In fact July was the eighth straight month with a year-over-year price decrease of at least 5%. The national market needs to show some clear signs of improving price trends before we should expect a similar turnaround in our market. Let's see what today's news brings when the NAR releases its statistics for the month of August. For more information on our local home and condo markets, visit the real estate trends page at DaneCountyMarket.com.

Sunday, September 21, 2008

Dane County median price, sales volume were lower in August

The preliminary numbers for the month of August are in. Here's how the combined home and condo numbers stack up against last year:

August 2008 versus August 2007

  • Median price: $220,000 versus $223,347 in August 2007, down 1.5%
  • Sales volume: 553 sold listings versus 694 listings in August 2007, down 20%

Year-to-date August 2008 versus YTD August 2007

  • Median price: $215,000 versus $216,000 in 2007, down .5%
  • Sales volume: 4,034 sold listings versus 5,238 listings in 2007, down 23%

For more information, view our full report, including the home and condo breakdown at DaneCountyMarket.com.

Wednesday, September 17, 2008

More adventures in house-hunting

You're bound to have a few odd stories when you tour a lot of homes. Two weekends ago a client and I ran into two surprises while touring homes on Madison's west side.

Surprise #1 came when we entered one home to find two cats waiting for us on the inside. Within a matter of seconds one cat jumped out and bit my client's sister. A few seconds after that the other cat lunged across the hall at my client. Needless to say we high-tailed it out of there without seeing much of the house.

Surprise #2 came during a FSBO showing. The owner escorted us through the home to show us each of the individual rooms, including the bedroom with a man crashed out on the bed. This was at 12:45 in the afternoon, 15 minutes before his scheduled open house. It was an awkward moment, one that ended quickly with our departure out the front door.

For the sake of these two owners it's too bad these showings were cut short. My client, like many other buyers, invests a lot of time researching neighborhoods and reviewing online listings and photos before she decides which homes she would like to visit. These two homes had already made her first cut, while dozens of other homes did not. Both of these sellers missed out on a good opportunity to sell their home to a ready and able buyer.

My client wrote her offer this week. The house she chose is vacant. No killer cats. No sleeping guy sprawled out on the bed.

Monday, September 15, 2008

What does the future hold?

The pending home sales index from the National Association of Realtors may provide some clues. From the NAR:

"The pending home sales index is a leading indicator for the housing sector, based on the pending sales of existing homes. A sale is listed as pending when the contract has been signed but the transaction has not closed, though the sale usually is finalized within one or two months of signing."

In other words the pending home sales index is intended to be an indicator of sales volume over the one to two months that follow each index report.

Here's how the July pending home sales index stacked up against other July's from the recent past:


The July value of 94.8 was the lowest index value out of every July dating back to 2001, back when the index was started. This implies that the sales volume numbers for August and September will be light, especially when you consider how the dynamics of the market have changed over the last year. Consider these realities:

  1. Pending contracts that are subject to the sale of another property are less likely to result in a closing compared to similar contracts from a year ago.
  2. Pending contracts that are subject to a bank's "short sale" approval often do not make it to closing.
Stay tuned. Let's see how lower interest rates and the first-time homebuyer tax credit as well as other elements of the Housing and Economic Recovery Act affect sales over the coming months.

Saturday, September 13, 2008

One big similarity between the Dane County and national real estate markets

We've covered how the Dane County and national real estate markets are different. Generally speaking, we're not seeing the severe price decreases that other markets around the country are experiencing. If you're interested in tracking the latest price trends, use a source that reports data specific to our market. You'll get a much better picture of our market from a source that uses local price data.

With that said, I'm a big believer that national sales volume reports are important to our market. Here's why. This graph shows national sales volume started to decrease on a year-over-year basis (noted by the red data points) in the Fall of 2005.


And this graph shows essentially the same trend for the Dane County market, with local sales volume starting to slip a little before the trend became clear at the national level.


It's a buyer's market right now because supply is high and demand is low. Supply will decrease and the market will shift when more buyers start to enter the market. When national sales do start to increase in a meaningful way, this will be a good indication that the foundation is in place for a shift toward a more balanced market. We'll check back in on the national sales figures over the coming months. In the meantime expect buyers to hold all of the cards, especially during the coming fall and winter months when the demand for housing will be predictably low.

Friday, September 12, 2008

Dane county home and condo sales showed a more moderate decrease in July

Dane County single family home sales were down 10% in July compared to July of 2007, while condo sales were down by 7%. The July condo numbers were a move in the right direction, as condo sales for each of the 4 prior months were lower by at least 25%.


One challenge we have with our real estate statistics is that they are all retrospective in nature; they only provide information on what has already happened. We'll address this by tracking the pending home sales index, which is designed to be a forward-looking indicator of sales activity. Once we get this up and running we'll be able to look forward in time and perhaps even gain some insight on when buyers begin returning to the market in a meaningful way.

Thursday, September 11, 2008

Dane County foreclosures increase in August

A total of 106 new foreclosures were filed in August, up 26% from the 84 filed in August of 2007. This graphs shows the monthly trend dating back to January of 2005. Foreclosures have been increasing on a year-over-year basis (noted by the red data points) for most of the past three years.


On a year-to-date basis, Dane County foreclosures are up by 51%.


When will foreclosures begin to decrease in a meaningful way? Most likely it's going to take some time. According to the Mortgage Bankers Association, a record 9% of all loans are either delinquent or in the process of foreclosure.

For more information on Dane County foreclosures, visit the Economic Trends page at DaneCountyMarket.com.

Tuesday, September 9, 2008

Mortgage rates fall upon announcement of Fannie Mae and Freddie Mac rescue plan

The federal government has taken over Fannie Mae and Freddie Mac. Why is this important? Fannie Mae and Freddie Mac currently finance over two-thirds of all loans originated in the U.S. Capital reserves had become dangerously low at both companies, endangering Fannie's and Freddie's ability to buy loans on the secondary mortgage market - and ensure the availability of loans. For those who want to learn more, NPR does a good job of explaining the Fannie and Freddie rescue program here.

The mortgage market has responded favorably to the rescue plan with lower rates. If you're thinking of buying your first home, you now have another good reason to start your home-buying plan right now. We recently covered the basics of the $7,500 first-time homebuyer tax credit. We also covered how sellers are more flexible this time of year when supply is high and demand is low.

You can start your home-buying plan by consulting with your lender. Take some time to learn about the financial implications of owning a home, how much home you can comfortably afford, and the mortgage application process. Once you and your lender have established a sound financing plan, then you'll have the foundation you need to begin the process of finding the right home for you.

For more information on the home-buying process, visit the Buying Real Estate page at DaneCountyMarket.com.

Sunday, September 7, 2008

Dane County housing starts were lower in August

Dane County housing starts continued at a sluggish pace, registering at 68 for the month of August compared to 122 from a year ago - down 44%. This graph shows the number of housing starts dating back to January of 2005. Housing starts have been on a downward trend (noted by the red data points) for most of the past three-and-a-half years.


In fact this past August was the slowest August for housing starts going back at least 10 years. Here are the August housing start numbers dating back to 1999:

  • August, 1999: 162
  • August, 2000: 177
  • August, 2001: 180
  • August, 2002: 204
  • August, 2003: 180
  • August, 2004: 216
  • August, 2005: 219
  • August, 2006: 111
  • August, 2007: 122
  • August, 2008: 68

Thanks to Dominic Collar from MTD Marketing Services for making this data available. For more information, feel free to call Dominic at 920/993-8435, or visit our Dane County housing starts report, which includes the latest monthly, year-to-date and historical trends - updated each month at DaneCountyMarket.com.

Saturday, September 6, 2008

Features of the new $7,500 first-time home buyer tax credit

The $7,500 first-time homebuyer tax credit was recently enacted as part of the Housing and Economic Recovery Act of 2008. We've outlined the basics for you below.

  • Tax credit amount: Up to 10 percent of the cost of the home, not to exceed $7,500.
  • Eligible property: Any single family, condo or co-op property that is used as a primary residence.
  • How it works: The credit reduces the tax liability for the year of the purchase. Buyers who use the credit by December 31st can apply the credit to their 2008 tax return.
  • Income limits: The full amount of the tax credit is available to individuals with an adjusted gross income of no more than $75,000 (or $150,000 for couples filing jointly). The tax credit is applied by a sliding scale and phases out at $95,000 for individuals and $170,000 for couples.
  • Other eligibility requirements: The purchaser and the purchaser's spouse may not have owned a principal residence in the 3 years prior to the purchase.
  • Alternative minimum tax ramifications: None. The tax credit will not put an individual into an AMT position.
  • Credit repayment: The claimant re-pays 6.67% of the credit each year for the next 15 years. If the home is sold before the 15 years is up, the claimant re-pays the remaining balance at the time of the sale.
  • Program ends: July 1, 2009.

Adding it all up, the tax credit essentially amounts to a 15 year interest-free loan. For example, let's suppose a first-time home buyer is eligible for the full $7,500 credit and purchases a home by December 31st, 2008:

  • The buyer will reduce her tax liability for her 2008 tax return by $7,500.
  • The buyer will gradually pay back the credit by paying $502.50 each year over the next 15 years.

Feel free to email me with any questions you may have about the plan. You'll also find this FAQ from the National Association of Realtors to be a handy reference.

Friday, September 5, 2008

How to research a home's MLS listing history

This post comes from Shawn Kriewaldt of Keller Williams Realty and DaneCountyMarket.com.

We recently covered how either you or your buyer agent can research a seller's mortgage and check for delinquent property taxes as you prepare to make your offer. Another step you can take in preparation for your offer is to research the home's MLS listing history.

The MLS listing history includes a lot of great information that can help you answer a number of questions about the home. For example:
  1. How long has the home been on the market?
  2. What was the original listing price, and how many times has the price been reduced?
  3. Has the property undergone any expired listings?
  4. What is the expiration date of the current listing?

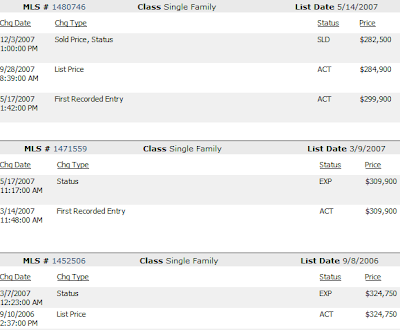
The answers to these questions can provide some good insight into the seller's frame of reference when it comes time to negotiate. As an example, take a look at the listing history for this Mount Horeb property.


Moving chronologically through the listing history (from bottom to top) we know the following about this home:

  1. It was originally listed on 9/10/06 for a price of $324,750. This listing expired on 3/7/2007 without an accepted offer.
  2. The seller re-listed the home on 3/14/07 for a price of $309,900. This second listing expired on 5/14/07.
  3. The seller re-listed again on 5/17/07 for a price of $299,900. On 9/28/07, the seller lowered the price to $284,900. The home ended up selling on 12/3/07 for a price of $282,500.

The listing history is available to MLS members only, so you will need to ask a real estate agent for this information if you are not already working with one.

How to research delinquent taxes

We recently covered how you or your buyer agent can research a mortgage in order to learn more about a seller's position prior to making an offer. Another good research item that you can pursue as a buyer is to take a look at whether or not the seller has fallen behind on his property tax payments. Researching delinquent taxes is easy and takes only a few minutes. Here's how you do it:

  1. Go to Access Dane.
  2. Select Public Access.
  3. Select Parcel Information.
  4. Select Query by Parcel Address.
  5. Enter the Address Number and Street Name and click Search. A property information page will appear, including a section on taxes that looks like this:


Not only does Access Dane provide information on annual property taxes, it also tells you whether or not there are delinquent (past due) taxes on a home, as in the example above. Why is this important? Because a seller will need to pay off any delinquent taxes before or at the time of closing before the property can change hands.

To find out how much the seller owes in back taxes (including penalties and interest), all you need to do is send an email to the Treasurer's Office. The Treasurer's Office will return your email with an itemization of how much the seller owes in back taxes, penalties and interest.